To make quick and informed decisions, it's important to have all your data in one place.
Each analytical tool is dependent on the quality and quantity of the data processed and displayed. Therefore, we will develop this functionality gradually in order to make selected indicators available to you as soon as possible.
The ultimate goal for us is to evaluate the data using artificial intelligence. We have already started our own research activities in this area.
We want you to have data processing available inside the application without the need for processing by an external tool.
Users with the Administrator or Owner role can find all current and future indicators in the left menu in the first block of tabs.
Each chart can be enlarged to full screen or downloaded (csv, png, svg formats) using ![]() or
or ![]() in the top right corner of the chart window.
in the top right corner of the chart window.
For charts that have a legend, you can dynamically change the view of the data by :
- just hover over the name in the legend and the corresponding data series will be highlighted in the chart
- click on the name in the legend to exclude a specific dataset from the chart
We are working on the feature so that you can build your own dashboard with data according to your wishes in the future.
The data are sorted into the following categories:
| Basic data | Absence | Workload | Demographic data |
| Documents | Recruitment | Competencies (skills) | Assets |
| Remuneration & Benefits | App usage |
Clicking on a category will take you to a detailed list of datasets already processed (in bold) or in the pipeline.
If you have a need for additional metrics, please note it here.
Basic data
- Number of active users
- Number of users by contract type
- New arrivals this year
- Departures this year
- Users by location
- Users by country of operation
- Number of active users by life cycle phase
- Number of all users by life cycle phase
- Reasons for contract termination
- Users by label
- Number of seats in the company (headcount)
- Turnover
- Duration of employee/contractor relationship
Absence
- Total absences by month
- Total scheduled absences by month
- Absence taken by day of the week
- Average length of absence by type
- Total balance of absences with fund
Activities
- Time spent on client
- Time spent on client projects
- Activities
- Home office usage time per month
- Time spent on business trips per month
- Projects and clients
- Number of events registered by specific client/project
- Average time spent on a specific client/project
-
- Number of events registered by specific client/project
- Average time spent on a specific client/project
Sloneek app usage
- Most active users of Sloneek
- Least active Sloneek users
Demographic data
- Composition of people in the company by age cohort
- Composition by gender
- Composition by health limitation
- Number of users in teams
Documents
- Total number of documents
- Documents by type
- Documents by tags
- Number of documents per department
- Users without an assigned document
- Documents requiring attention (expiration, no signature or read)
Recruitment
- New positions posted this year
- Number of applicants per position after each recruitment phase
- Time to hire (time between applying for the selection process and joining the company)
- Average Time to hire (average time between applying for the selection process and joining the company)
- Effectiveness of candidate sourcing channels (by individual position / overall average) - find out which search channels are most effective for different positions to optimise your recruitment strategy
- Reasons for rejection of applicants (per position/overall average) - identify common reasons for rejection of applicants and address potential problems in the recruitment process
- Time spent at each stage of the recruitment process (per position/ overall average) - identify the stages where delays occur and take measures to streamline the process
- Time to hire (by individual position/ overall average) - understand the timeline for hiring to increase efficiency, compare the time it takes to hire employees for different positions
- Time to fill (per position/overall average) - evaluate the speed of filling job offers, identify areas for process improvement to reduce time to fill.
- First Year Attrition - assess employee retention and identify potential issues, implement strategies to improve first-year retention.

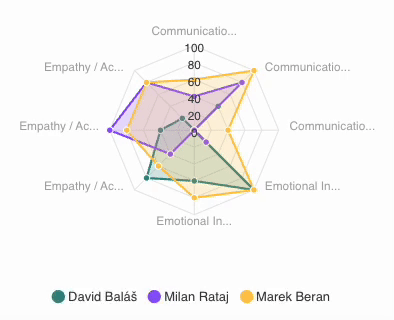
Competencies (skills)
- Distribution of the level of fulfilment of competences (skills) in the associated evaluation model
- Comparison of competency (skill) assessments over time
- Competence (skills) with a set rating scale of YES / NO and with an assigned rating of NO
- Allocated competency models (skill sets)
- 10 least developed competences (skills) in the company
- Currently assigned development areas
- Missing competency (skill) assessments
A detailed description of the analytics can be found in the article here.
Assets
- Total number of assets
- Assets by handover status (accepted, rejected, pending, stock)
- Assets by category
- Assets by status of use
- Number of assets requiring attention (awaiting confirmation, returned, not received)
- Users without an assigned asset
- Number of assets by department/team
Remuneration & Benefits
- Total remuneration expenditure - bases/fixes only (total, by team)
- Total bonus expenditure
- Total deductions
- Competitive Compensation Ratio: A comparison of an organization's average compensation to that of competing organizations, usually expressed as a percentage.
- Benefit Utilization Rate (percentage of employees who use benefits offered by the organization. - Blocked benefit modules.