Sloneek processes a large amount of data so you can make exact reports of what you need.
Links to the individual reports can be found here:
Content:
| Intro to reports | How to set it up? | New report | Generated reports |
| Export reports | Save filters | Order of columns | Grouping data |
| Pivot mode | Copying data | Table settings | Favourite reports |
Introduction to the reports
All our reports are asynchronous. The magic of such reports is that when you create a report with a large amount of data, you can leave it running with peace of mind and start working on something else in the application. The report will continue to be generated and when it's finished, you'll get a notification in your app and in your email that everything is ready. In addition, you can also check at any time how much percentage is left to complete the report.
In addition, you can also build your own sets of reports with the required data. You can then easily run these reports for selected users, teams or the entire company. Let's see how to do it.
How to set the report configuration?
When you go to any report from the menu, you will see a page divided into two parts. The first one is named as Your report configurations and below it you will find Your generated reports. In order to see any data in either section, you must first create a configuration or report.
To create a report configuration, simply click on the Create a new report configuration button on the top right. Here you name the configuration, describe it further if necessary, and select for whom the report will generate data. For example, if you select for the entire company, whenever you run a report from this configuration in the future, the report will include all users. If you set the configuration for selected teams, select below for which teams you want to generate the report.
You then have the option to choose whether you want to include inactive users in the report, or which events to include in the report (e.g. only holidays). By default, however, the report is generated for all events.
Then just save the configuration or generate a new report directly from this configuration.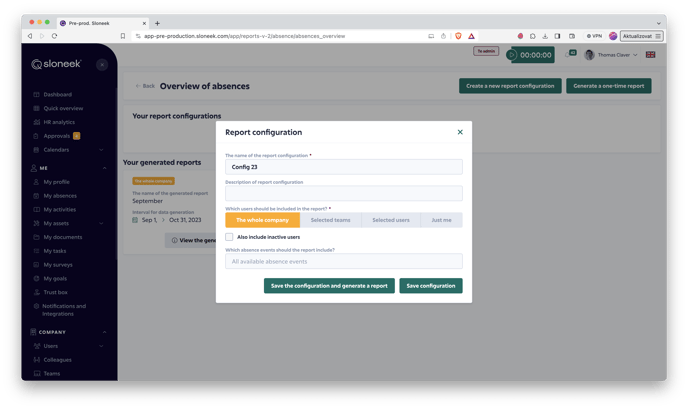
Creating a new report
You can either generate a new report from a predefined configuration by clicking the Generate a report according to the configuration button, or you can create a one-time report by clicking the Generate a one-time report button.
The report will then start generating in the background of the application, and once it is ready, you can navigate to it, edit it further, or export it. You may read more about setting up and displaying reports below.👇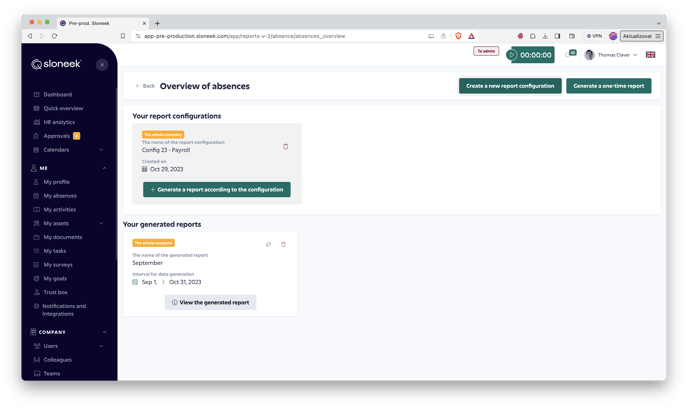
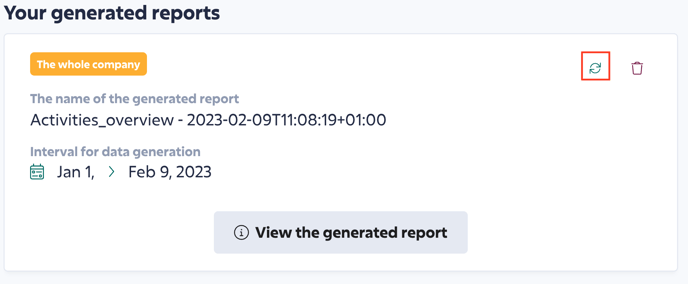
It may happen that after generating a one-time report, its data has been modified. To avoid having to re-generate the report, simply click ![]() to refresh the data. You can then view the report with the modified data.
to refresh the data. You can then view the report with the modified data.
Exports data from reports to Excel
In each report you have 2 options to export data from the set table:
📍click on button ![]()
📍or right-click on any cell or click on the "hamburger" icon in the report header. Select Export to XLS. Subsequently, all visible (filtered) data of the current table are exported.
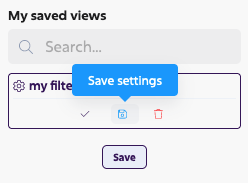
Save and set filters in tables
You can save the settings of columns and table filters in reports directly in the report table. Use the TABLE SETTINGS in the right bar of each table:
-
First, set up the table as you need
-
Go to SETTINGS, name and save your filter
You can have as many reports as you need.
The saved setting remains active until it is replaced by another filter or reset in Settings
You can re-edit and reload already saved reports.
Adjust the order of the columns
Grouping data by columns
Working in Pivot mode
Pivot mode is particularly useful in the Overview of activities report, where it can group users, activities or projects into logical units and give you totals of work done. This includes differentiation by activity status (approved, pending, cancelled).
To turn on Pivot mode, click on Columns in the right sidebar of the report and slide the switch to Pivot mode: ![]()
Then drag n' drop the desired items below into the Row Groups, Values and Column labels area. You can move e.g. name, activity name, project or client to the row groups. In the values you can add the duration of the activity or the hourly cost rate. In the column labels, you can move the state of activities to split them into approved, pending, and cancelled.
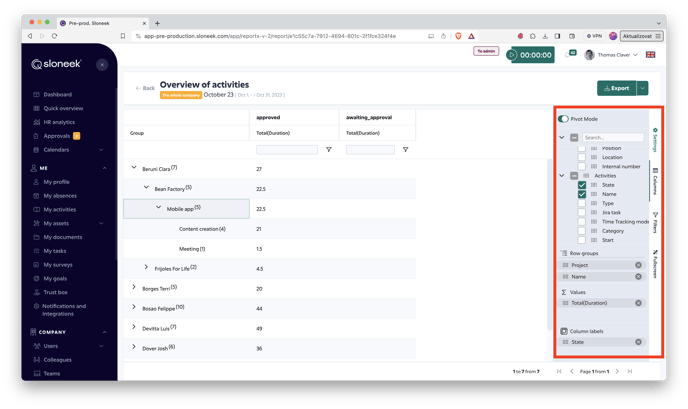
If you will be using the Pivot mode (see image above), don't forget to set the activity status to distinguish activities as approved, pending or cancelled.
Pivot can be set to display the status either in rows or in columns. In the latter case, drag the State item not into the Column labels area, but into the Row Group.
Copying data from tables
Click and drag to select any part of the table. Right-click and select Copy or Copy, including column headings. Then paste into Excel (ctrl + V on Windows, or better cmd + V on Mac)
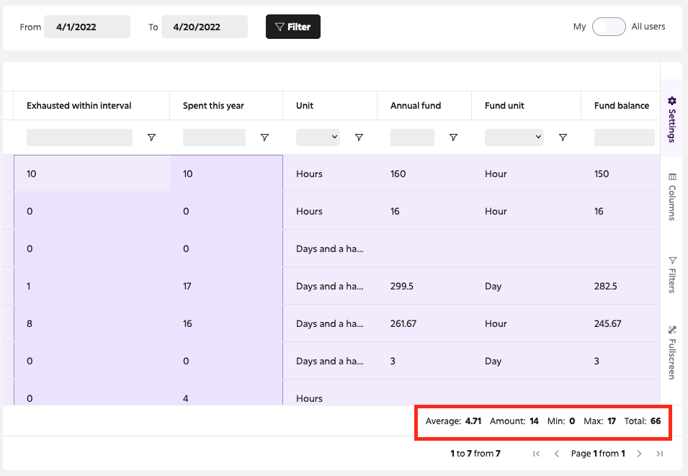
Report table settings - column anchoring, width, numeric summaries
When you hover the mouse over the table header cell, the “Hamburger” menu will appear 
Click on it to get a number of options for editing tables, such as anchoring columns, setting automatic column widths, and more.
As in Excel, it is possible to average the values in the columns, add them or check their total number.
Add reports to your favorites
For each report, you will now find a star symbol which, when clicked, will save the report as a favourite. You will then find a toggle on the right above all reports that will take you to the list of favourite reports.